A dedicated dashboard widget that displays all version information in an at-a-glance format on your WordPress Dashboard.
Dashboard Widget
The Dashboard Widget adds a dedicated "Version Info" meta box to the main WordPress Dashboard screen, giving you an organized view of your site's technical stack every time you log in.
What It Displays
In its baseline (free) form the widget shows the following information in a clean, structured layout:
- WordPress version (with update link if available)
- PHP version
- MySQL version
- Web Server software
With a PRO license active, the widget also gains an Environment row and a Database Size row by default.
Live System Resources (PRO) (2.0.2+)
PRO licenses unlock a second toggle in Settings > Version Info > General called "Show Live System Resources in Dashboard Widget". The child row appears dynamically once the parent dashboard-widget toggle is enabled. With both options checked, the dashboard widget surfaces the full collected dataset (25+ rows in semantic groups):
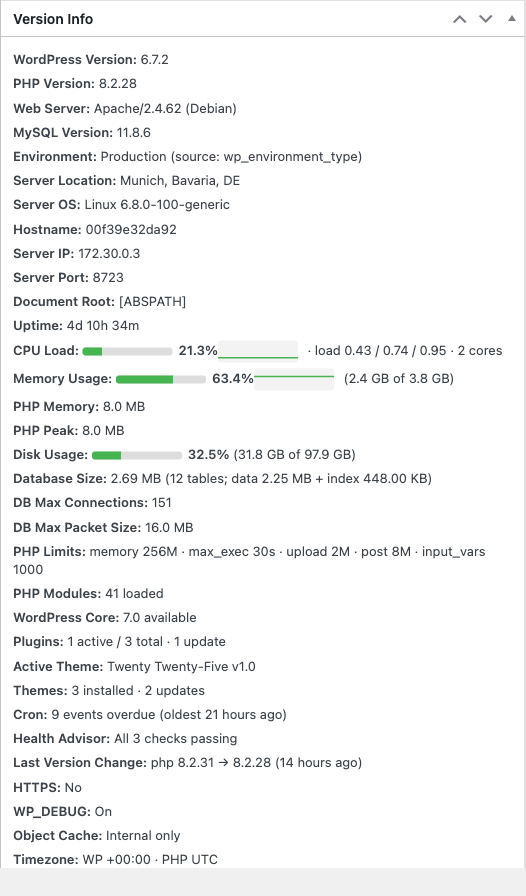
- Identity: Environment (with detection source), Server Location, Server OS, Hostname, Server IP, Server Port, Document Root, Uptime
- Live resources: CPU Load (percent bar + inline-SVG sparkline + 1/5/15-minute load averages + core count), Memory Usage (system memory bar + sparkline + used / total), PHP Memory, PHP Peak Memory, Disk Usage (percent bar + used / total of
ABSPATH) - Database: Database Size (total + table count + data/index split), DB Max Connections, DB Max Packet Size
- PHP runtime: PHP Limits (memory_limit, max_execution_time, upload_max_filesize, post_max_size, max_input_vars), PHP Modules (every loaded extension with version, collapsible)
- WordPress status: WordPress Core update availability, Plugins (active / total / updates), Active Theme + version, Themes (installed / updates), Cron (next-event / overdue summary)
- Diagnostics: Health Advisor critical/warning/good counts, Last Version Change
- Misc config: HTTPS, WP_DEBUG + debug.log size, Object Cache backend, WP and PHP Timezones
The CPU and Memory bars (plus their sparklines) redraw in place on every WordPress Heartbeat tick (15-second cadence on the Dashboard screen). Each sparkline keeps a rolling 30-sample history in browser memory — that's roughly 7.5 minutes of recent direction-of-travel at the dashboard cadence. The sparkline stroke uses the same green / orange / red thresholds (70% / 90%) as the bar so a row turning red is reinforced visually in two places.
Aggregate values that don't change second-to-second (disk, plugin counts, cron, PHP limits, server location, uptime, OS, hostname, IP, etc.) are gathered behind a 5-minute transient — filterable via the version_info_widget_extras_ttl filter — so the widget stays snappy regardless of installation size. Server Location specifically uses its own 30-day transient (vi_server_location) on top, because location doesn't drift.
Enabling / Disabling
The Dashboard Widget is disabled by default. To enable it:
- Navigate to Settings > Version Info > General.
- Check Show Version Info as Dashboard Widget.
- (Optional, PRO) Check Show Live System Resources in Dashboard Widget to enable the full live HUD described above.
- Click Save Changes.
If the widget doesn't appear after enabling it, check the Screen Options tab at the top of the Dashboard page. Ensure the "Version Info" checkbox is checked. WordPress allows users to hide any dashboard widget via Screen Options.
Customizing Widget Content
Developers can modify the items displayed in the dashboard widget using the version_info_dashboard_widget_items filter:
add_filter( 'version_info_dashboard_widget_items', 'customize_widget_items' );

function customize_widget_items( array $items ): array {
    // Add a custom item to the dashboard widget
    $items['hostname'] = [
        'label' => 'Hostname',
        'value' => gethostname(),
    ];
    return $items;
}