Real-time system resource monitoring for CPU load, memory usage, and database size, delivered directly to your WordPress admin dashboard.
System Resources
This is a PRO feature. Unlock real-time monitoring, environment indicators, version history, and more. Upgrade to PRO →
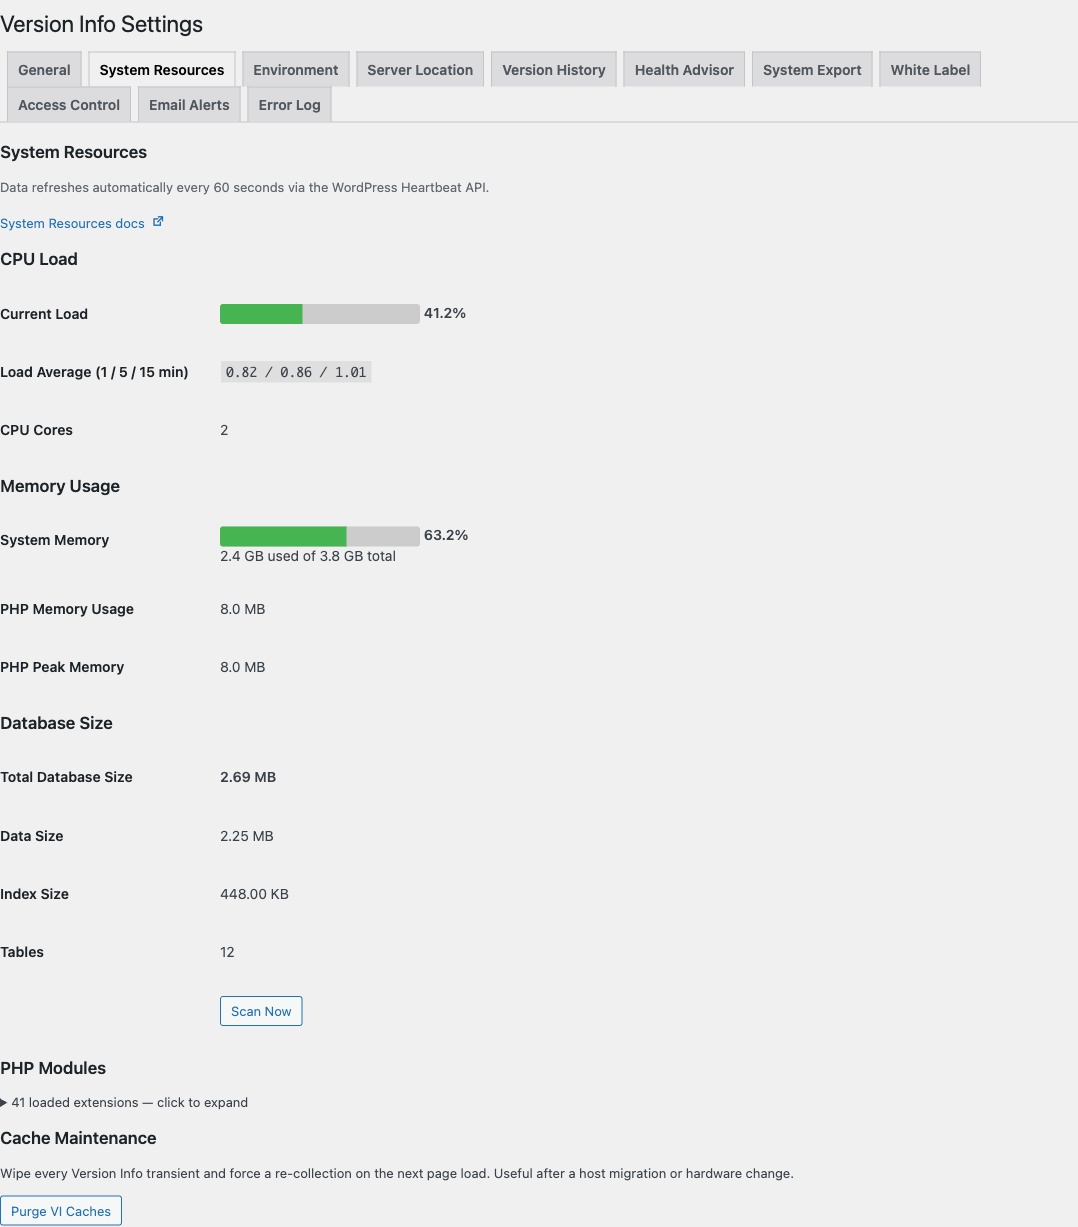
The System Resources feature gives you a real-time view of your server's health without leaving the WordPress admin. Data is displayed using visual percentage bars and updates automatically via the WordPress Heartbeat API.
What's Monitored
System Resources tracks the following categories of server metrics:
- CPU Load - Current usage percentage, load averages, and core count. Inline-SVG sparkline on the dashboard widget shows the rolling 30-sample history.
- Memory Usage - System RAM usage, PHP memory usage, and peak PHP memory. Sparkline on the widget as well.
- Database Size - Total database size, data size, index size, and table count, plus DB max connections + max allowed packet.
- Disk Usage (2.0.2+) - Percent bar + used / total of
ABSPATH. - Server Location (2.0.2+) - Auto-detected via our anonymous Cloudflare Worker (default), Cloudflare cdn-cgi/trace, ip-api.com, or MaxMind GeoLite2 — or manually overrideable. See the Server Location docs.
- Server Uptime (2.0.2+) - Linux
/proc/uptimeformatted as12d 4h 27m; "Unavailable" on Windows. - Server OS / Hostname / IP / Port / Document Root (2.0.2+) - From
php_uname(),gethostname(),$_SERVER['SERVER_ADDR'],$_SERVER['SERVER_PORT'], and a path-masked$_SERVER['DOCUMENT_ROOT']. - PHP Modules (2.0.2+) - Collapsible list of every loaded extension with version.
The 2.0.2 additions close the parity gap with the long-stale wp-server-stats plugin (last released 2017-11-24) without inheriting its shell_exec() dependency that breaks on managed hosts. A one-click Purge VI Caches button on this tab wipes every Version Info transient at once for a forced re-collection.
Where It Appears
System Resources data is displayed in the System Resources tab under Settings > Version Info. Each metric is shown with a visual percentage bar that is color-coded based on usage levels:
| Usage Level | Color | Threshold |
|---|---|---|
| Low | Green | Below 70% |
| Medium | Orange | 70% - 89% |
| High | Red | 90%+ |
Live Updates
Resource data is refreshed automatically every 60 seconds via the WordPress Heartbeat API. This ensures the data stays current without requiring manual page refreshes.
The Heartbeat API interval is configurable via the version_info_cache_ttl filter. The default is 60 seconds.
Performance Impact
All resource metrics are cached using WordPress Transients to minimize server load:
- CPU and Memory: Cached for 60 seconds (configurable via
version_info_cache_ttlfilter) - Database Size: Cached for 12 hours (configurable via
version_info_db_cache_ttlfilter)
Version Info never calculates resource-heavy metrics on every page load. The caching strategy ensures the plugin maintains minimal impact on server performance.
For details about each resource type, see the sections below: